|
Description of Web Interface.
«Monitoring»
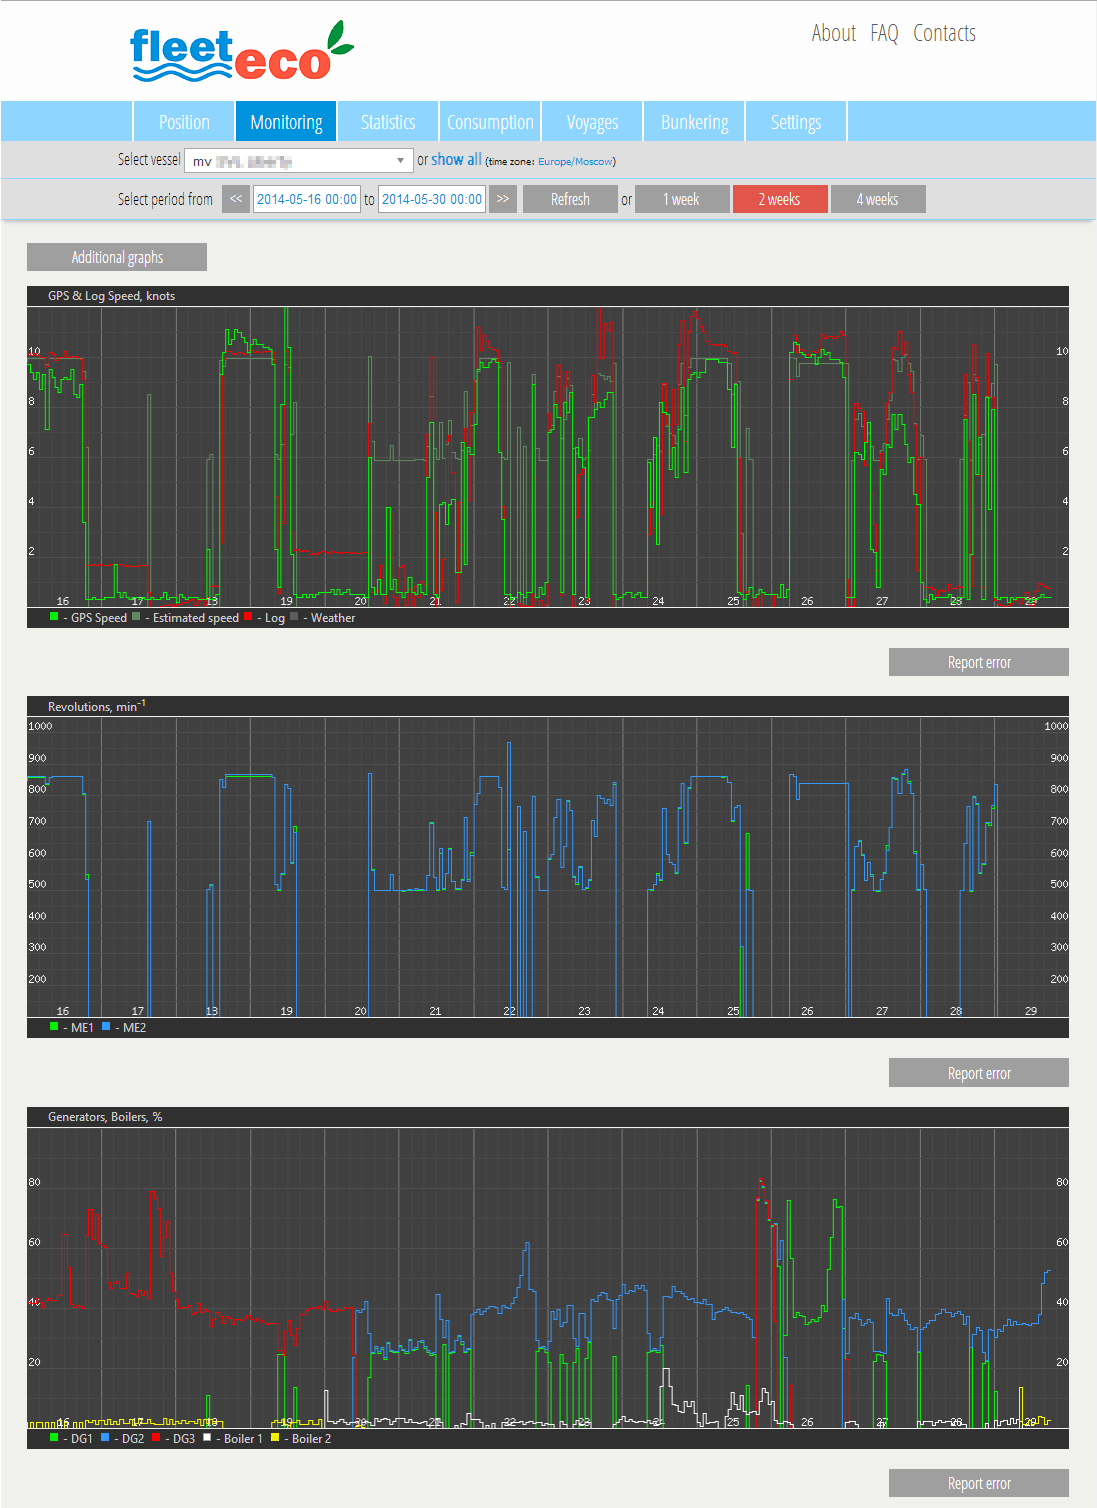
The Monitoring section shows three graphs. The vertical lines on the graph correspond to 00:00 (midnight) for each day of the selected period.
The first graph shows the ship's speed by log (red line), and by GPS (green line) as well as weather conditions (dark gray line). If the ship does not have log, the log speed is considered the same as the GPS speed.
The second graph shows revolutions of the main engines: the first in green, the second in yellow, the third in red, etc.
The third graph shows power output (as a percentage of the maximum) of the ship's diesel generators: the first in green, the second in yellow, the third in red, etc.
Above the map is the date panel. To see the ship's location at a different point in time, select the date on the panel (and time, if desired) for the start of the time period, the end date and click "Refresh". The page will be refreshed. It is not recommended that a time period of more than 60 days (2 months) be selected as the page will load very slowly. To see information for the last 4 weeks, click on «4 weeks».
|